
REBGV president Jill Oudil said “Demand remains elevated and listings scarce in the attached and apartment markets across Metro Vancouver,” in the Feb 2, 2018 stats report. Read full report here: Home buyer demand depends on property type
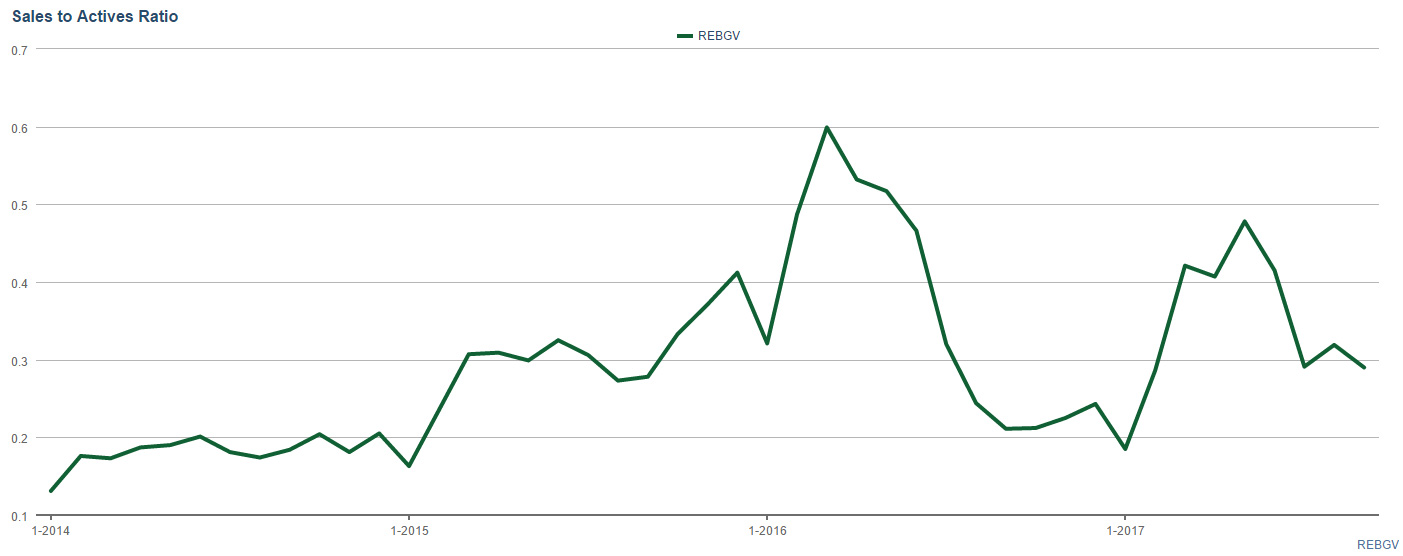
We can see the buyer demand and seller supply from the sales-to-active ratios:
- Sales-to-active listings ratio for Jan2018 was 26.2% for all property types (upward pressure on price if ratio remained 20% for sustained period – which has been the case since March 2015)
- Sales-to-active listings ratio for different property types in November:
- 11.6% for detached homes (downward pressure on price if remained below 12% for sustained period of time)
- 32.8% for townhomes (seller’s market – upward pressure on price)
- 57.2% for apartments (seller’s market – upward pressure on price)
In today’s market, if you are buying single family houses, there are less competition and more selection in homes. House buyers have more luxury to pick and choose and negotiate the price. If you are in the market today to buy condos, get ready for multiple offers! For condo buyers, you have to have your financing and emotions ready.
So all this talks about statistics and ratios, what most people want to know is still the price. Will it go up or will it come down? Sellers want the price to go up and buyers want the price to go down. So here’s a comparison of two charts, the first chart is the Sales to Actives ratio that tells the supply and demand of homes. The second chart is the MLS HPI price that measures typical, pure price change.

No wonder people say, don’t wait to buy real estate, buy real estate and wait.
In January, typically a slow month, we sold a condo for $54,000 over asking price in a multiple offers situation. The unit sold for $29,000 more than a similar unit which was sold just one week ago. The condo market is still hot depsite the new mortgage rule with more stringent stress test for borrowers that came into effect this January.
According to Residential Mortgage Quarterly Review by First national Financial LP, the new rules have the Canadian Real Estate Association forecasting a slowdown in home sales in Canada. None the less, it expects to see prices rise in Quebec, New Brunswick and Nova Scotia. The energy dependent provinces Alberta, Saskatchewan and Newfoundland and Labrador are expected to see no movement or slight declines.
But for British Columbia, the price are expected to hold steady. Read full article here.


